India's Inflation Just Hit a 19-Month High. The Cause Might Surprise You
India's July retail inflation rose to a 19-month high of 4.45%, but the jump owes more to a gold and silver rally than to overheating demand. Here is what it means for RBI rate cuts, bond yields and the rupee.
India's headline retail inflation rate rose to 4.45% in July 2026, its fastest pace in 19 months, according to provisional data released by the Ministry of Statistics on 12 August. On the surface that reading looks like a warning shot for a central bank that has spent the year trying to nudge borrowing costs lower. Look inside the numbers and a different story appears. The bulk of the acceleration came from a jewellery-counter rally in silver and gold, plus a short list of vegetables, rather than from an economy running too hot. For anyone trying to guess when the Reserve Bank of India will cut rates again, that gap between the headline and its drivers is the whole game.
What happened#
The Consumer Price Index rose 4.45% in the year to July, up from a final reading of 4.38% in June, the statistics ministry reported. It was the highest print since the 5.2% recorded in December 2024, as Forbes India noted. Rural inflation ran hotter at 4.84%, while urban inflation was a milder 3.96%. Food prices, measured by the Consumer Food Price Index, climbed 5.52%, up from 5.32% the month before.
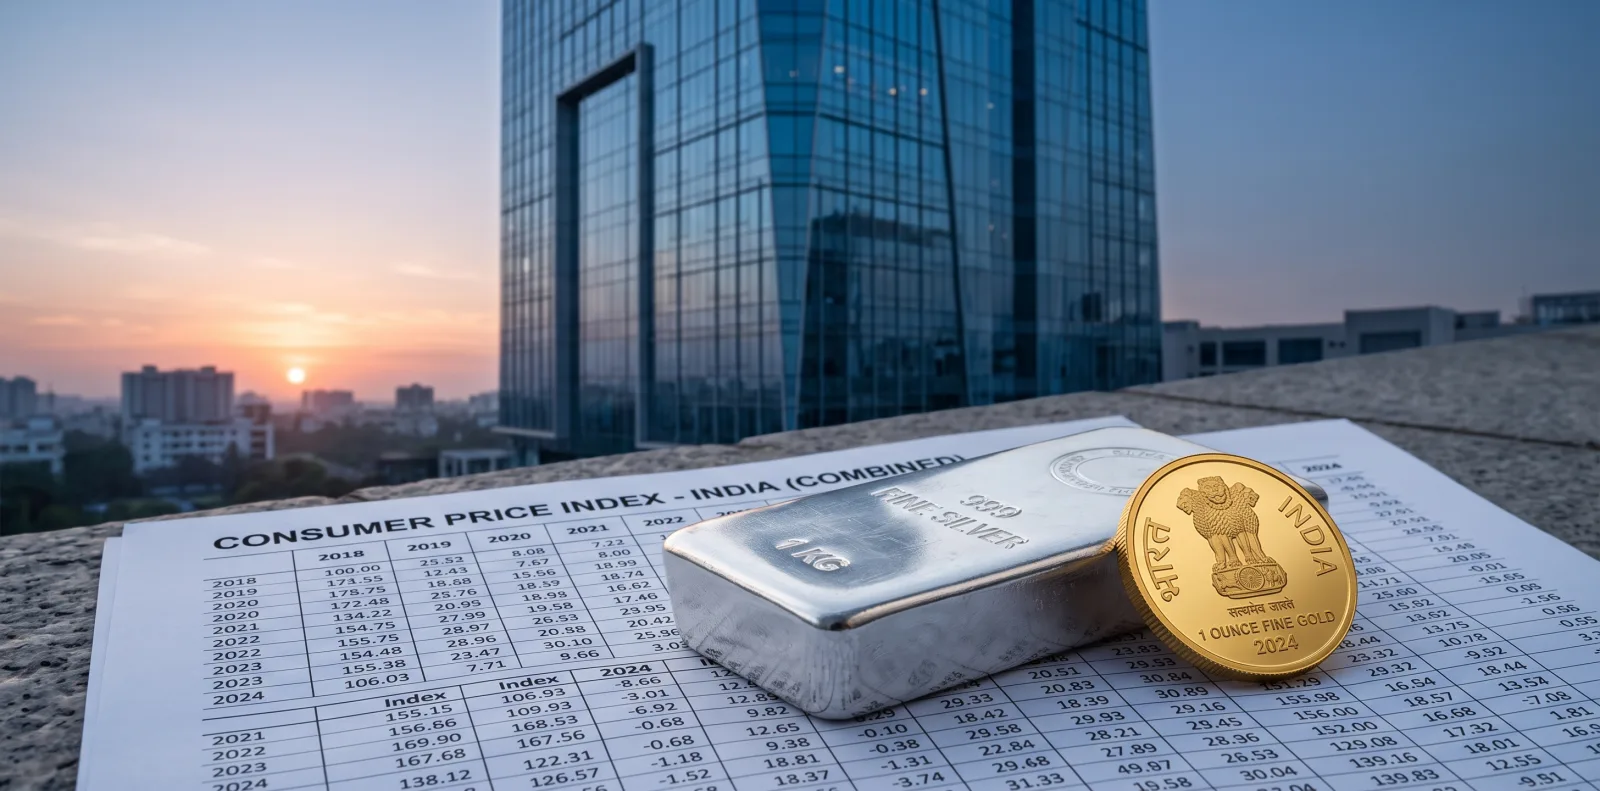
The silver jewellery prices were up 109.84% over the year, and gold, diamond and platinum jewellery rose 32.98%, per the official release. Ginger jumped 83.62%, garlic 35.36% and onion 22.54%. Pulling in the other direction, potato prices fell 16.56%, motor cars and jeeps dropped 6.72%, and the broad "purchase of vehicles" category deflated by 4.37%. In short, a few volatile lines pushed the average up while several everyday goods were getting cheaper.
Markets took the number in stride. Reuters reported that the print was unlikely to alter the RBI's rate outlook, since it sat comfortably inside the central bank's tolerance band and its composition looked temporary rather than entrenched.
Reading India's inflation gauge#
The CPI tracks the average change in prices paid by households for a fixed basket of goods and services. India rebased the index to a 2024 base year, so the July figure of 107.94 indicates the basket costs about 8% more than in the 2024 reference period. Each item carries a weight that reflects how much a typical household spends on it, which is why a 109% surge in silver jewellery, with a weight of just 0.31%, lifts the headline only modestly rather than dominating it.
Two sub-measures matter for policy. The Consumer Food Price Index isolates food, which makes up a large share of Indian household budgets and tends to swing sharply with weather and harvests. Core inflation, the measure economists watch most closely, strips out food and fuel to reveal the underlying trend in prices that move slowly, such as rents, services and manufactured goods. When a headline rises but core stays soft, central bankers usually treat the spike as noise.
The RBI runs a flexible inflation-targeting framework. Its mandate is to keep CPI inflation at 4%, within a band of 2% to 6%. July's 4.45% is above the 4% midpoint but well inside the band, which is why the print prompted analysis rather than alarm.
What it means across asset classes#
For fixed income, the reading is the main event. Indian government bond yields had been drifting in a narrow range, with Bank of Baroda expecting the 10-year benchmark to trade between roughly 6.70% and 6.85%. A hotter-than-feared core reading would have pushed yields toward the top of that range by dimming hopes of a cut. Because the jump was concentrated in volatile items, the immediate upward pressure on yields was limited, and traders largely held their existing positions.
For equities, the signal is indirect but real. Lower policy rates reduce the discount rate applied to future company earnings and tend to support valuations, especially for rate-sensitive sectors such as banks, non-bank lenders, property and consumer durables. A sticky inflation print delays that support. Bank margins are a two-sided story: higher-for-longer rates can protect net interest margins in the near term, yet they also slow loan growth if households and firms defer borrowing.
For the rupee, inflation interacts with a tense external backdrop. Energy prices have been volatile amid conflict in the Middle East, and a weaker rupee raises the cost of imported oil, which then feeds back into domestic prices, a channel Forbes India flagged in its coverage. If the RBI is seen tolerating above-target inflation while cutting rates, the currency can weaken further, so the central bank has to weigh growth support against currency stability.
For commodities and gold specifically, the data is almost a mirror. The precious-metals rally that lifted the CPI reflects global safe-haven demand. Indian households are among the world's largest buyers of gold, so international bullion prices pass quickly into the domestic basket. That makes gold both a driver of the print and a hedge that many investors hold against the very uncertainty it causes.
How a jewellery rally leaks into the CPI#
The CPI is a weighted average of price changes, known as a Laspeyres-type index, which holds the basket fixed and measures how much more it costs today. Volatile, low-weight items can still move the headline when their price changes are extreme. Silver jewellery rising 110% is a large enough shock that even a 0.31% weight nudges the aggregate.
Base effects add another layer. Year-on-year inflation compares this July with last July. If prices were unusually low a year ago, the annual rate looks high today even without fresh price pressure this month. Gold and silver have been climbing for several months, so part of the July reading reflects where prices sat in mid-2025 rather than a new burst of demand.
This is why analysts separate headline from core. The official item table shows the divergence clearly: precious metals and a few vegetables surging, while vehicles, potatoes and many manufactured goods soften. A demand-driven inflation problem would show up as broad pressure across services and core goods, not a narrow spike in bullion. The RBI's own projections lean the same way. At its August meeting the central bank pencilled in core inflation of about 4.3% for the year, a level consistent with a soft underlying trend even as the headline jumps around.
Reasons for caution#
Food inflation at 5.52% is uncomfortable in a country where food is a heavy share of the household budget, and vegetable prices can stay elevated if the monsoon disappoints. A run of bad harvests would turn a statistical quirk into a genuine cost-of-living squeeze, particularly in rural areas where the rate is already higher.
The external picture is fragile. The RBI expects inflation to peak at around 5.9% in the October-to-December quarter of the current fiscal year, driven by food, fuel and input costs. If Middle East tensions push oil higher and the rupee weaker, imported inflation could broaden beyond today's narrow drivers. At that point the "look through it" argument weakens.
There is also a data-composition caveat. Because the surge sits in a handful of items, a reversal could pull inflation down just as quickly, which cuts both ways for anyone building forecasts off a single month. Provisional figures can be revised. And a central bank that has already held four times in a row has limited appetite to be surprised, which biases it toward patience rather than pre-emptive cuts. The counter-view, held by some economists, is that persistent food and energy pressure could even force a rate hike later in the year, though that remains a minority case.
An echo of past inflation scares#
India has been here before. Through 2020 and 2021, supply shocks and precious-metals demand repeatedly lifted the headline CPI while core inflation stayed contained, and the RBI generally chose to look through the volatility. The current episode rhymes with that pattern rather than with the demand-led inflation of a booming cycle.
Set against the last two years, this looks like a cyclical wobble, not a structural break. Inflation has drifted up from a low of 2.74% in January 2026 to 4.45% in July, as the ministry's own back-series shows, a normalisation from unusually soft readings rather than a fresh overheating. The RBI's decision to raise its FY27 growth forecast to 6.7% while holding rates at 5.25% and keeping a neutral stance fits an economy expanding at a healthy clip with inflation that is firm but not yet threatening. The structural questions, such as how a weaker rupee and shifting global trade rules reshape import costs, sit outside this single data point.
Key takeaways#
- India's CPI inflation rose to a 19-month high of 4.45% in July 2026, up from 4.38% in June.
- The jump was concentrated in precious metals and a few vegetables, while vehicles and several manufactured goods deflated, so headline heat overstates underlying pressure.
- Core inflation, the measure the RBI watches most closely, is projected to be near 4.3%, pointing to a soft underlying trend.
- The print sits within the RBI's 2% to 6% band and is unlikely, on its own, to prompt a central bank that has held rates at 5.25% for four consecutive meetings.
- The real risks are external: higher oil prices, a weaker rupee, and a possible inflation peak near 5.9% later this year could broaden the pressure beyond today's narrow drivers.
Frequently asked questions#
Why is 4.45% called a 19-month high if it is still below 6%? It is the fastest annual pace since December 2024, when inflation was 5.2%. The "high" refers to the trend, not a breach of the RBI's upper limit of 6%, which the reading remains well below.
Does this reading rule out a rate cut this year? Not by itself. Reuters reported that the print was unlikely to change the RBI's rate outlook because it sits within the tolerance band and its drivers appear temporary. A durable cut still depends on core inflation, food prices, and the rupee's behaviour over the next few months.
Why did gold and silver push the CPI up so much? Indian households buy large amounts of jewellery, so global bullion prices feed quickly into the domestic basket. Silver jewellery rose about 110% and gold jewellery about 33% year on year, enough to lift the average despite their small weights.
What is the difference between headline and core inflation? Headline CPI includes everything, including volatile food and fuel. Core strips those out to show the slow-moving trend in items like rents and services. When core stays soft while the headline jumps, central banks usually treat the spike as temporary.
How does inflation affect the stock market? Higher-for-longer interest rates raise the discount applied to future earnings and can slow lending, which weighs on rate-sensitive sectors such as banks, lenders and property. Softer inflation, which allows rate cuts, tends to support those valuations.
What is the RBI's inflation target? The RBI aims to keep CPI inflation at 4%, within a band of 2% to 6%, under its flexible inflation-targeting framework. July's 4.45% is above the midpoint but inside the band.
Could inflation rise further from here? The RBI expects a peak near 5.9% in the October-to-December quarter, driven by food, fuel and input costs. Whether it climbs that far depends heavily on oil prices and the rupee.
References#
- Ministry of Statistics and Programme Implementation, Press Release, Consumer Price Index for July 2026 (primary source, official government release, 12 August 2026).
- Forbes India, July retail inflation inches up to 4.45%.
- Reuters via Investing.com, India July inflation accelerates to 4.45%, unlikely to alter RBI rate outlook.
- Upstox, India's retail inflation grows to 4.45% in July 2026, shows NSO data.
- Upstox, RBI policy August 2026: rates unchanged at 5.25%, inflation likely to peak at 5.9% in Q3 FY27.
- India Infoline, RBI policy update August 2026: repo rate unchanged at 5.25%, FY27 GDP growth raised to 6.7%, inflation forecast cut.
- FocusEconomics, India central bank meeting: RBI holds again in August.
- Bank of Baroda via NewKerala, India's 10-year bond yield likely to trade in 6.70-6.85% range.
This article is for information only. It is not investment advice, a recommendation to buy or sell any security, or a forecast presented as certainty. Figures cited are provisional where noted and subject to official revision. Verified facts, market interpretation and forward-looking estimates are distinguished in the text.